State-by-state data on COVID-19 vaccinations in the United States
To be able to track the vaccination campaign in the United States, we are making the United States Centers for Disease Control and Prevention’s data available in the following charts. We are updating the data daily.
Our default selection for the charts is based on the 10 states that have administered the most vaccine doses per 100 people (as of February 2021), as well as the 20 largest states by population.
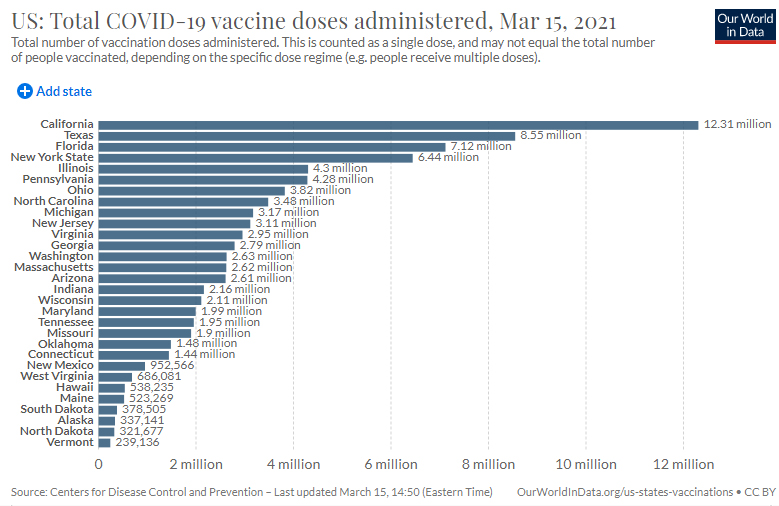
The following charts show the total number of COVID-19 vaccination doses administered, and the number of administered doses per 100 people. Note that this is counted as a single dose, and may not equal the total number of people vaccinated, depending on the specific dose regime (e.g. people receive multiple doses).